“Do we have it?” is only the first question. Next come “where?”, “how much?” and “which transactions explain the stock?”. ERP Core’s Stock Overview and product details help you check this information in context.
 Example: a customer needs 20 units
You have 12 units in one warehouse and 15 in another. A total of 27 does not mean you can pick 20 from the first location. In this demonstration scenario, check the product, unit of measure and location breakdown before confirming how the order will be prepared.
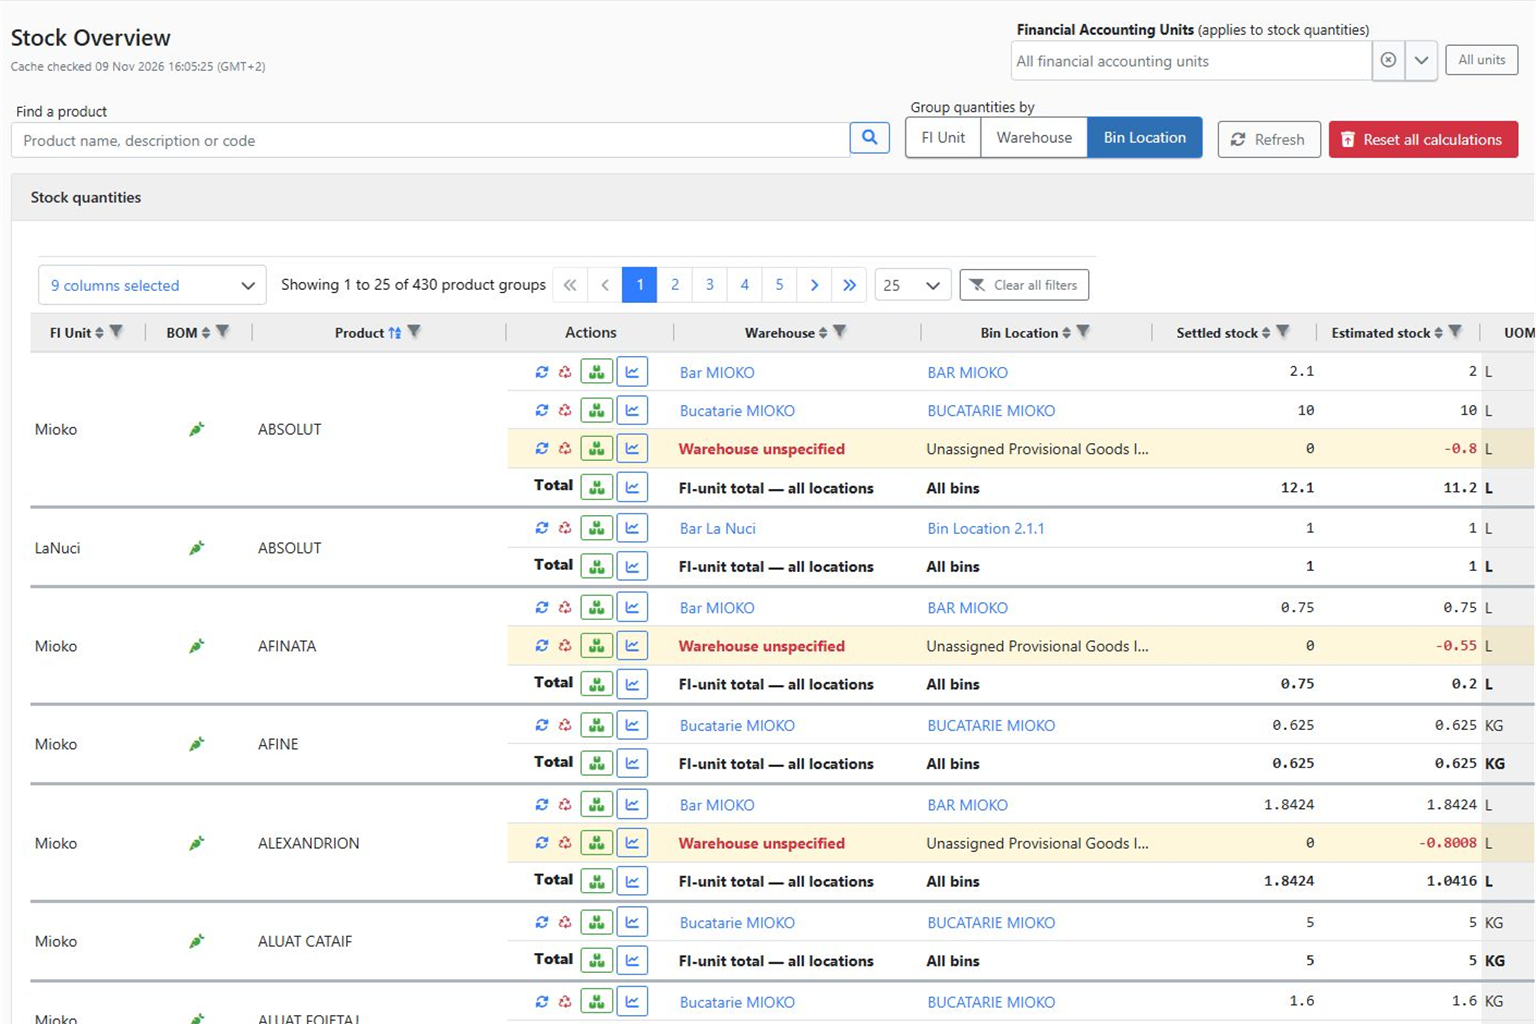
1. Find the product and compare locations
In Stock Overview, search by name, description or code. Select the units and quantity grouping, then check the warehouse, bin location and unit of measure. In the screenshot below, the same product can have several location rows followed by a total. A total does not represent availability in a single bin.
2. Review movements and open the chart
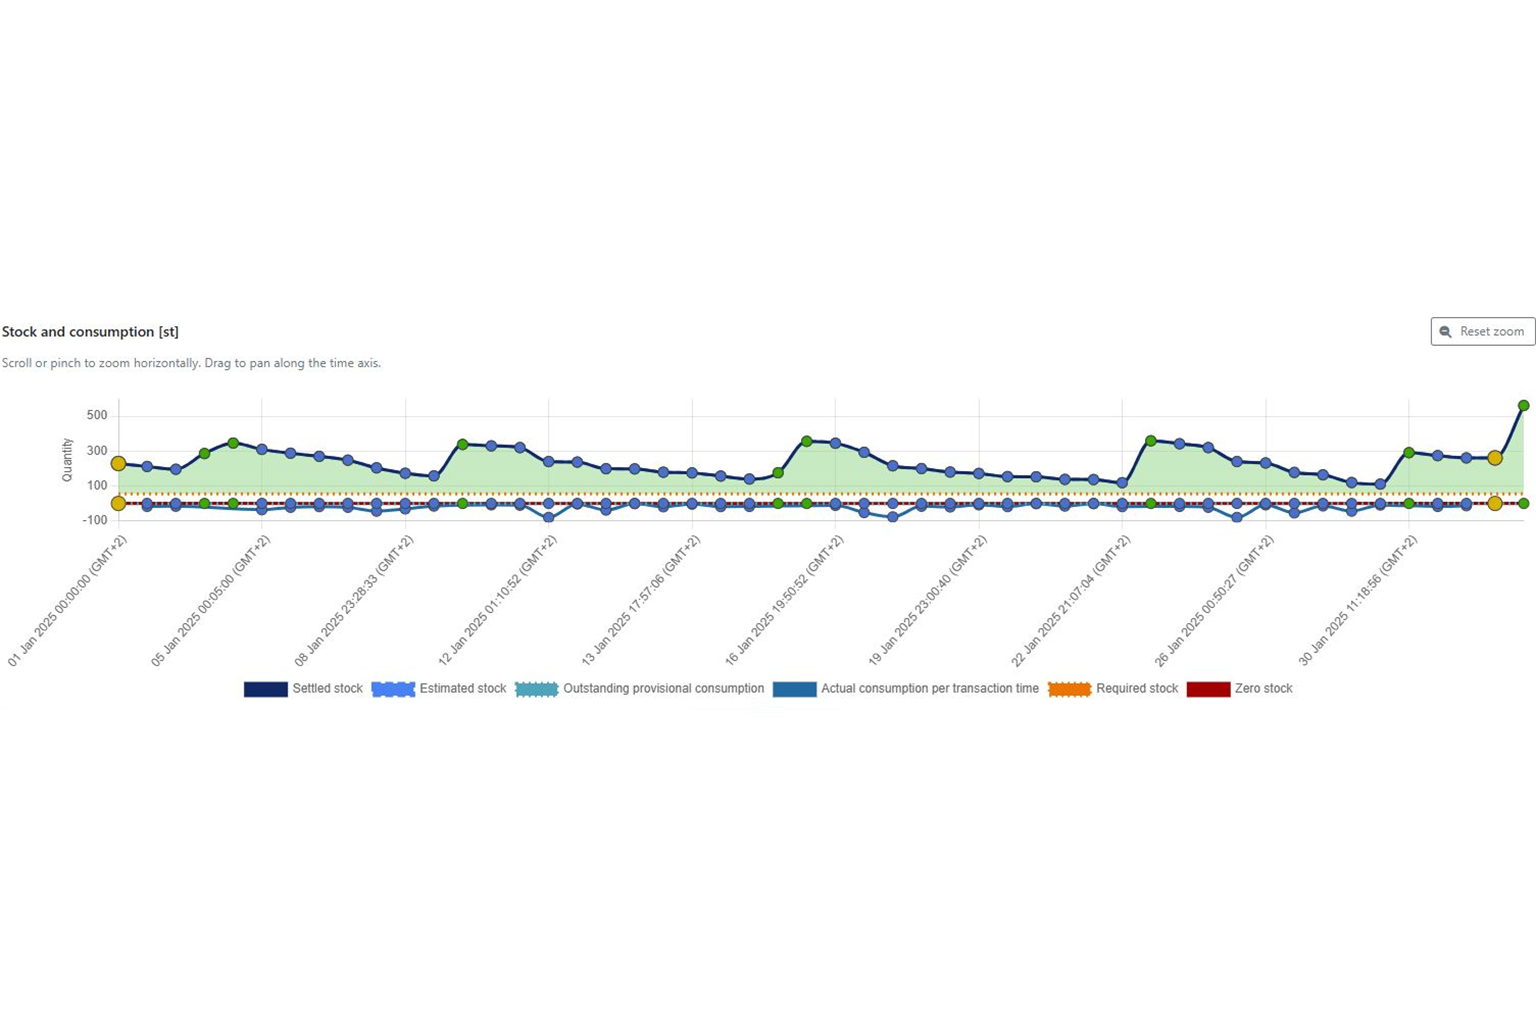
On the product row, find the chart icon in the Actions column: Stock transaction chart. Choose the relevant date range and review stock and consumption over time. If a decrease looks unusual, narrow the period and investigate the corresponding transactions and documents.
What can a chart tell you?
In a shop, a product’s stock repeatedly falls before the end of the week. The chart helps you spot the pattern and choose a period to analyse. Then check receipts and issues: a decline may result from sales, consumption or other transactions. The chart is a starting point for a decision, not an automatic explanation of the cause.
Why does calculation status matter?
ERP Core displays stock recalculation status. If a quantity is marked as being updated, wait for completion before relying on it. Settled stock, pending consumption and estimated stock have different meanings and should not be treated as interchangeable.
Useful for retail, distribution and manufacturing
A distributor checks where goods are stored. A workshop follows raw materials. A restaurant reviews ingredients. In every case, the decision starts with the correct product and location.
Shall we walk through a scenario?
Request an inventory and charts demonstration. Using demonstration data, we can follow the same product from receipt to stock movement analysis.